
Introduction to Mental Health Infographics
Why Mental Health Matters in 2025
In 2025, mental health is no longer a quiet conversation happening behind closed doors. It’s a global concern that shapes the way people work, learn, and live their daily lives. With the pressures of fast-paced technology, economic uncertainties, climate anxiety, and constant digital connectivity, more people are talking openly about mental health. What’s different now compared to ten years ago is that people expect practical solutions, resources, and clear education to make sense of it all.
That’s where mental health infographics step in. They take something complicated—like depression statistics or coping strategies—and turn it into an easy-to-read visual. In a world filled with endless text and numbers, visuals make the message clearer, faster, and more impactful.
Overview of Top Mental Health Challenges Today
Some of the main issues people face in 2025 include:
- Rising cases of anxiety and depression across all age groups
- Workplace stress and burnout from hybrid and remote jobs
- The growing link between sleep problems and mental health disorders
- The effects of digital overload and social media comparisons
- Rising youth mental health concerns, especially linked to isolation and pressure
These challenges don’t just show up in medical journals. They appear in real life—your colleague struggling with stress, your friend losing sleep, your child feeling anxious about school. Mental health infographics are powerful because they help people see these problems in a simple, direct, and relatable way.
What Are Mental Health Infographics
Definition and Key Features of Mental Health Infographics
A mental health infographic is a visual tool that explains data, concepts, or coping strategies around mental health in a way that’s quick and clear. Think of it as a poster, chart, or graphic that combines text, icons, charts, and colors to make information more digestible.
Good mental health infographics usually include:
- Clear headlines and short text blocks
- Simple icons or illustrations that represent emotions, habits, or statistics
- Data points that highlight key facts without overwhelming the viewer
- Actionable tips that someone can follow immediately
Role of Mental Health Infographics in Education and Awareness
Education is often the first step toward positive change. Schools, workplaces, and healthcare providers use mental health infographics to explain complex issues in a way that sticks. Instead of reading a 20-page report on anxiety, a student can glance at a one-page infographic and remember the main points.
Campaigns that fight stigma also rely on visuals. A well-designed infographic about suicide prevention or stress management can spread across social media quickly, reaching thousands of people who might never read a detailed article. By combining facts with visuals, infographics not only educate but also encourage action.
Mental Health Trends in 2025
Common Mental Health Issues Facing Modern People
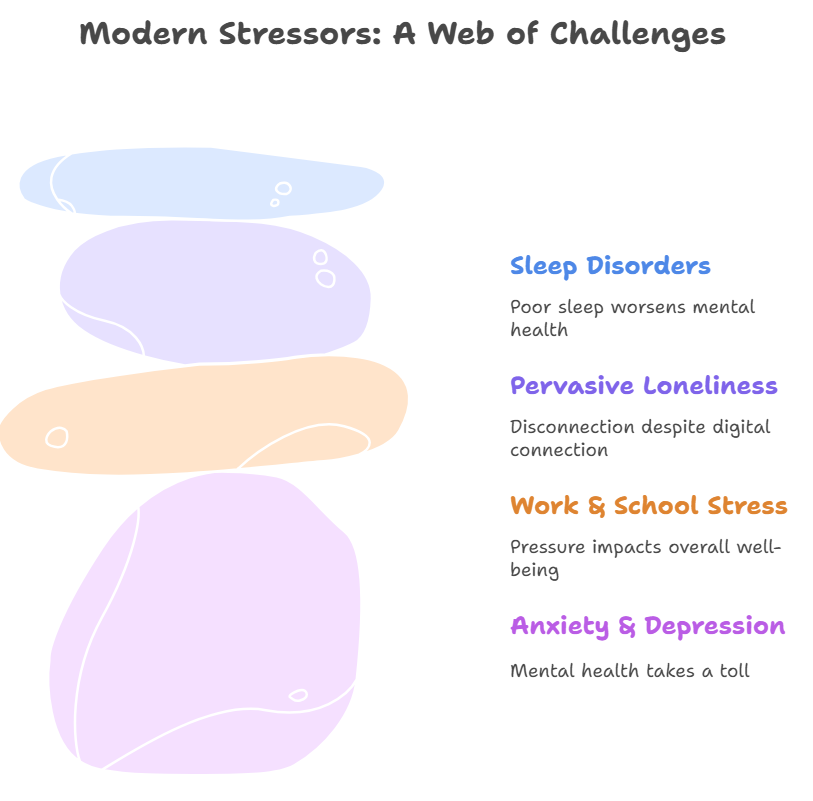
If you ask almost anyone in 2025 what’s stressing them out, you’ll hear a mix of personal, professional, and digital challenges. Anxiety and depression remain at the top, followed closely by stress from work and school. Many people are also struggling with loneliness despite being “connected” all the time through technology.
Sleep disorders are another big factor. Research shows that poor sleep doesn’t just make you tired—it increases your risk of depression, anxiety, and even long-term physical health problems.
Data-Driven Insights from Mental Health Infographics
Data tells the story best when it’s visual. For example, an infographic showing how many young adults experience depression each year instantly communicates the scale of the problem. With tools like VisualGPT, creators can take raw data and turn it into a polished infographic that grabs attention.
Even organizations are relying more on AI-powered tools such as the AI Infographic Generator to transform mental health survey results into visuals that anyone can understand. These visuals help policymakers, educators, and individuals see patterns and act faster.
Top 10 Mental Health Infographics and Topics
Key Components of Mental Health Infographics
Before diving into the top topics, let’s note what makes a mental health infographic effective:
- Simple layout with a logical flow
- Use of relatable visuals, like icons for sleep or stress
- Accurate sources backed by research
- A call to action (such as hotlines, coping tips, or lifestyle advice)
Now let’s look at the top 10 infographic topics in 2025.
Mental Health Infographic 1 – Trends in Anxiety and Depression
Anxiety and depression are the most common mental health struggles today. A strong infographic could show the rise in cases since 2020, comparing adults, teens, and older adults. It might include icons for therapy, medication, and lifestyle tips to show coping methods.

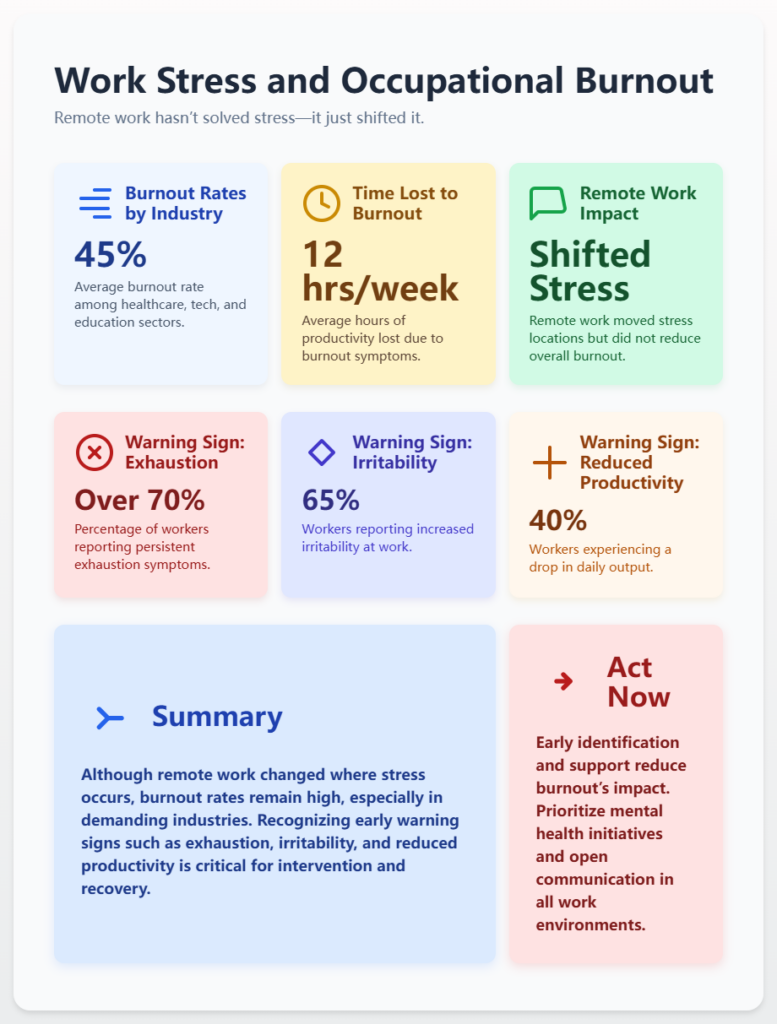
Mental Health Infographic 2 – Work Stress and Occupational Burnout
Remote work hasn’t solved stress—it just shifted it. An infographic might show how burnout rates are higher in industries like healthcare, tech, and education. It can also outline warning signs like exhaustion, irritability, and reduced productivity.
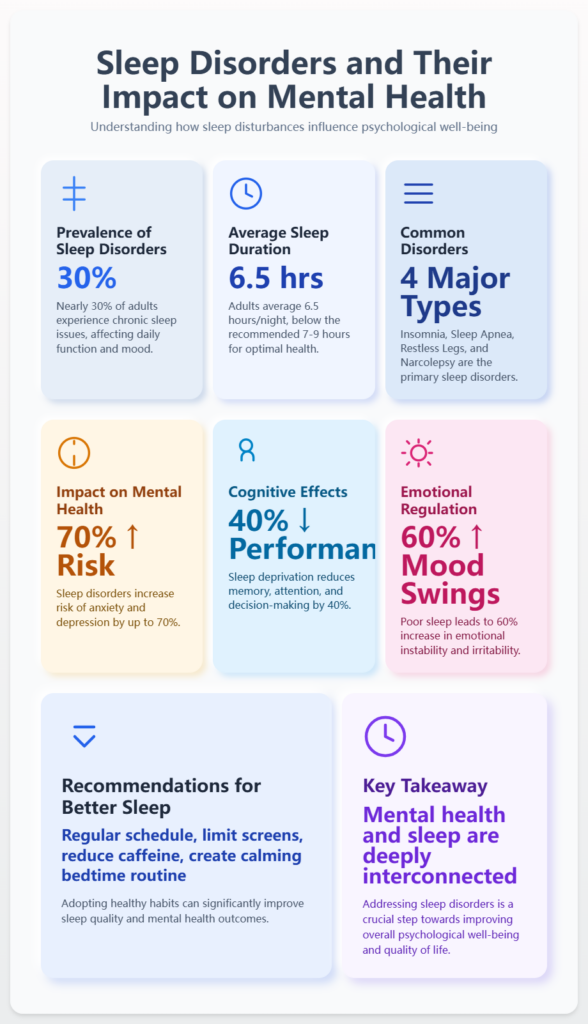
Mental Health Infographic 3 – Sleep Disorders and Their Impact on Mental Health
Lack of sleep is connected to mood swings, poor focus, and depression. A visual infographic might show the cycle: poor sleep → stress → worse sleep → deeper mental health problems. Adding simple tips like setting a bedtime routine helps the reader act immediately.
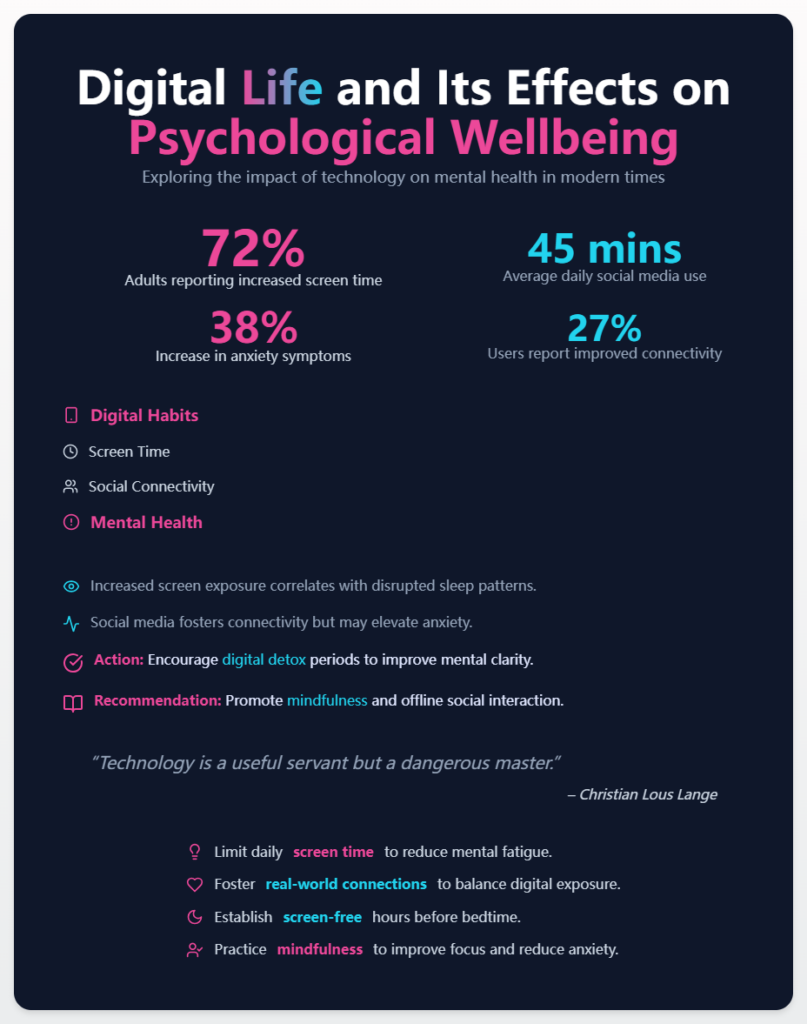
Mental Health Infographic 4 – Digital Life and Its Effects on Psychological Wellbeing
We spend more hours online than ever before. Infographics here can highlight screen time stats, symptoms of digital fatigue, and suggestions like “digital detox weekends.”
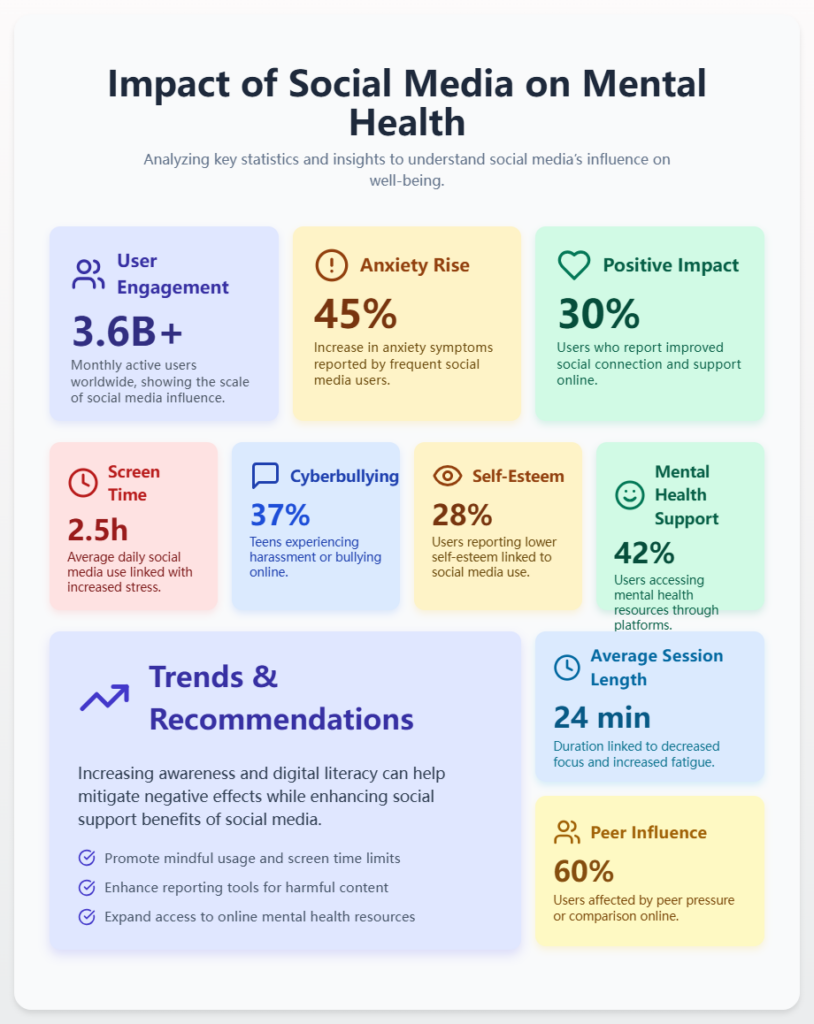
Mental Health Infographic 5 – Impact of Social Media on Mental Health
Comparing yourself to others online is a huge source of stress. Infographics can show how excessive social media use relates to body image issues, anxiety, or fear of missing out.
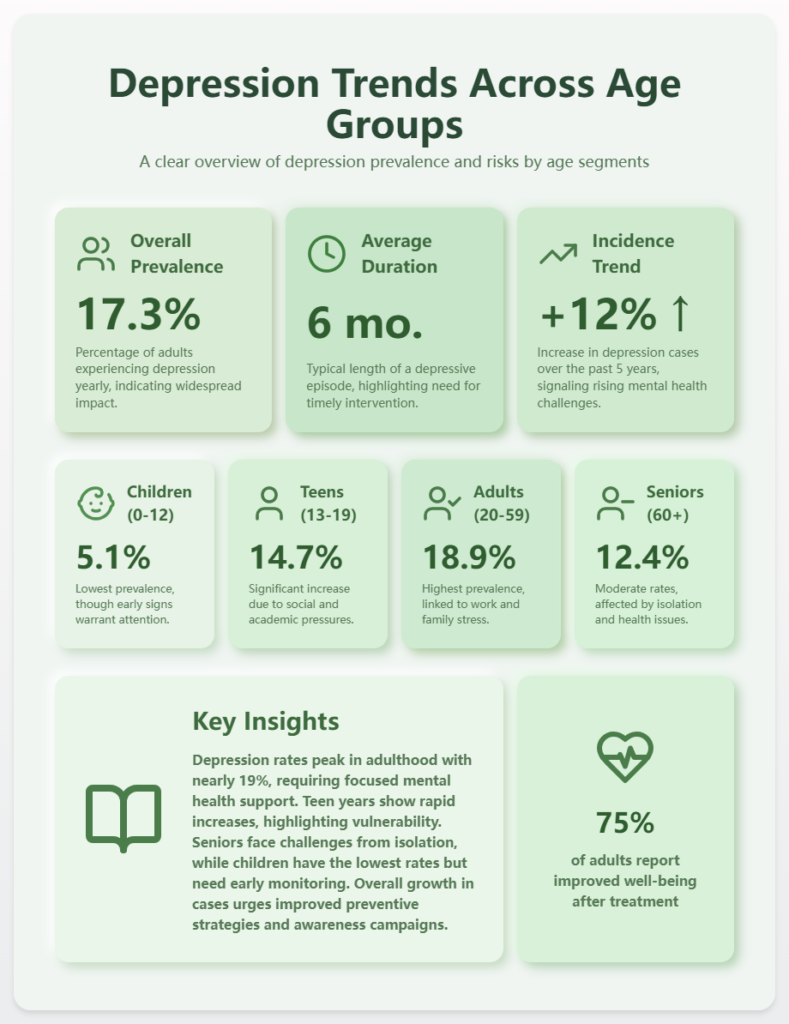
Mental Health Infographic 6 – Depression Trends Across Age Groups
This infographic might break down depression by children, teens, adults, and seniors. It could reveal that younger groups report higher anxiety, while older adults deal more with loneliness.
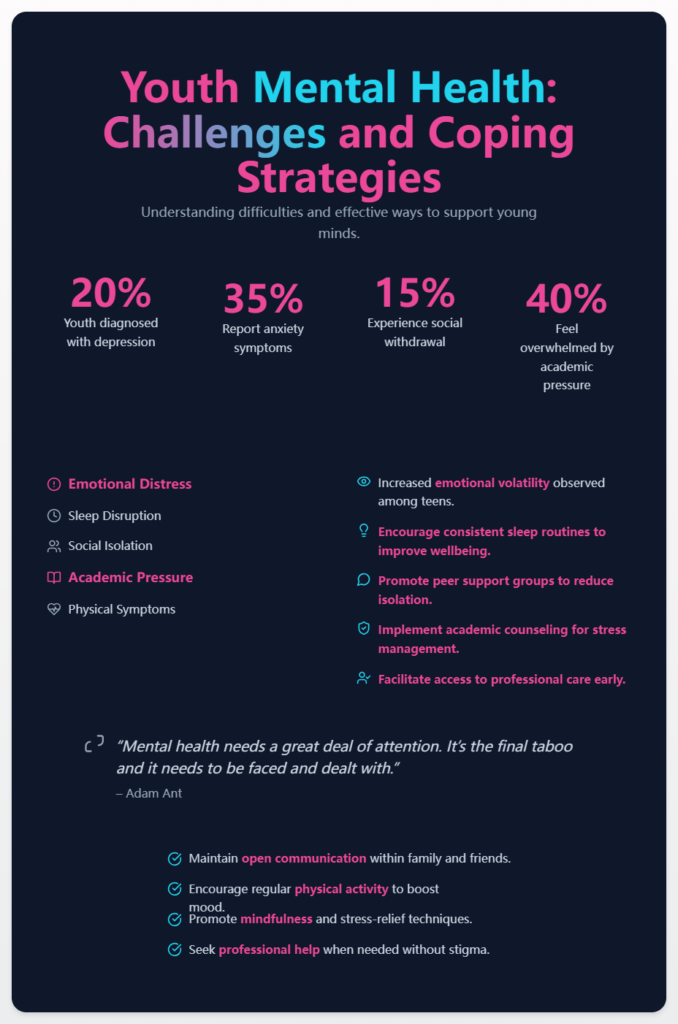
Mental Health Infographic 7 – Youth Mental Health: Challenges and Coping Strategies
Schools and parents look for visuals that help kids understand emotions. Infographics for youth might include cartoon-like icons and step-by-step tips for handling stress, like talking to a trusted adult or practicing mindfulness.
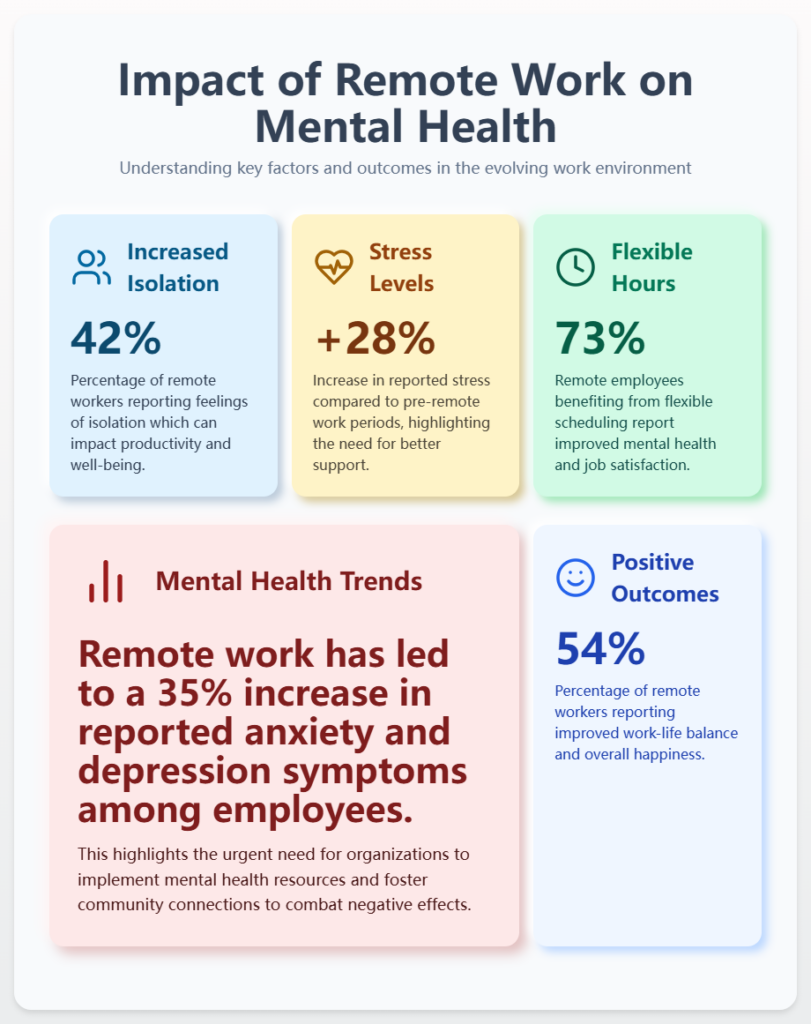
Mental Health Infographic 8 – Impact of Remote Work on Mental Health
The shift to remote and hybrid work has pros and cons. An infographic might balance benefits (flexibility, no commute) against challenges (loneliness, blurred work-life boundaries).
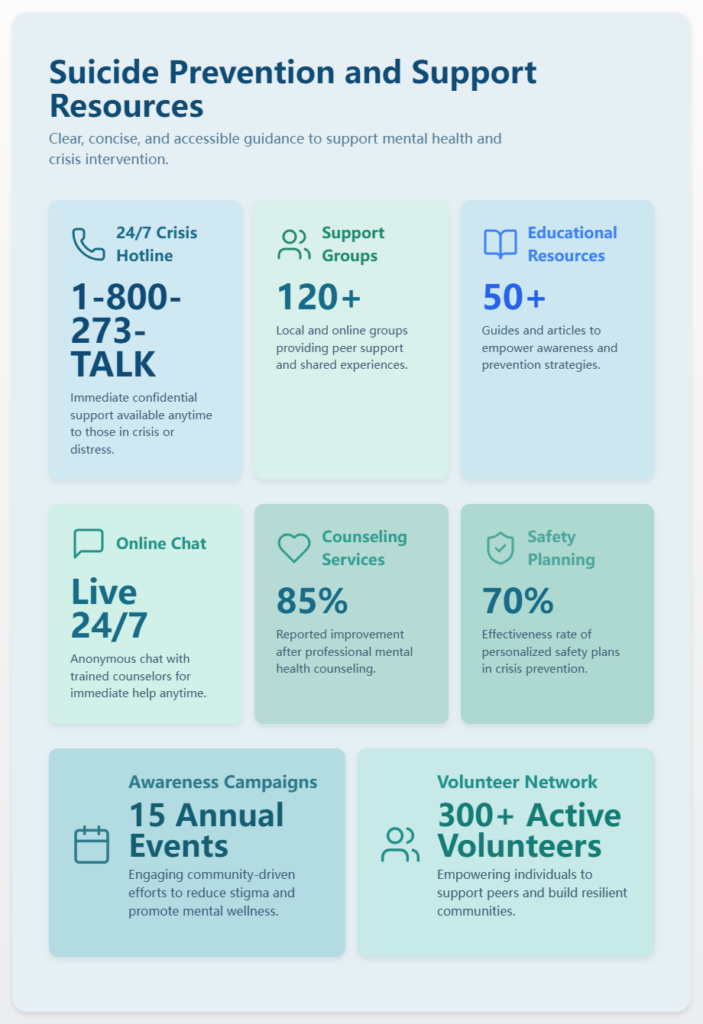
Mental Health Infographic 9 – Suicide Prevention and Support Resources
One of the most sensitive topics, suicide prevention infographics highlight warning signs and emergency hotlines. These must be designed with empathy and clarity.
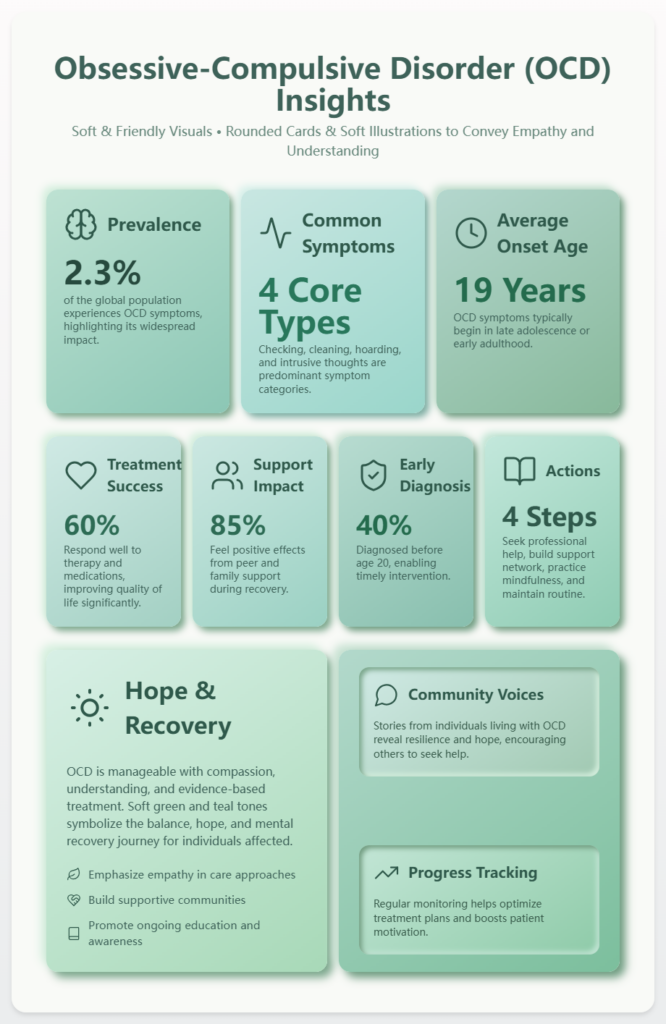
Mental Health Infographic 10 – Obsessive-Compulsive Disorder (OCD) Insights
OCD is often misunderstood. An infographic could explain common symptoms like repetitive thoughts and compulsive behaviors, while also pointing to therapy and support groups.
How to Use Mental Health Infographics
For Personal Awareness and Education
You can use mental health infographics to better understand your own struggles. A chart on anxiety symptoms might help you realize you’re not just “overthinking”—you’re experiencing something many others go through.
For Education, Training, and Public Awareness Campaigns
Teachers, HR managers, and nonprofits often share infographics to spark discussion. In classrooms, they can help students learn coping skills. In companies, they can remind employees about stress management or available resources.
For Social Media and Content Sharing
Infographics are perfect for Instagram, LinkedIn, and Pinterest. Because they’re visual, they spread quickly. A well-designed mental health infographic can reach thousands of people in just a few hours.
Tools & Tips for Creating Mental Health Infographics
Best Tools for Mental Health Infographics
Some of the most popular tools include:
- Canva – beginner-friendly templates
- Piktochart – strong for charts and data-heavy visuals
- VisualGPT – advanced AI-powered tool that quickly generates custom infographics, saving time and giving a professional look
You can also try the AI Infographic Generator, which works perfectly for mental health topics since it blends text and visuals with AI suggestions.
Design Tips
- Use calming colors like blues and greens for mental health themes
- Avoid clutter—stick to 3–4 key points per infographic
- Use icons (like a pillow for sleep or a laptop for work stress) to make concepts memorable
Key Considerations for Mental Health Infographics
Always double-check your data and cite trustworthy sources like WHO or CDC. When dealing with sensitive topics like suicide prevention, accuracy is not optional—it’s critical. Also, make sure you use copyright-free images or create original visuals.
Step-by-Step Guide to Create Mental Health Infographics
Step 1:Choose Your Topic and Collect Information Start by picking a mental health theme, such as anxiety, work stress, or sleep disorders. Gather facts, statistics, or tips from reliable sources like WHO, CDC, or academic studies. The more accurate your data, the stronger your infographic will be.
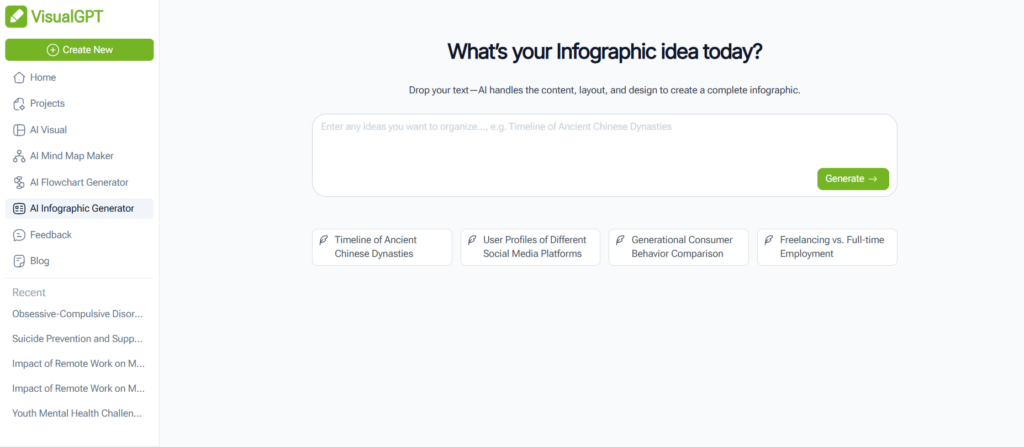
Step 2:Open VisualGPT’s AI Infographic Generator Go to the AI Infographic Generator inside VisualGPT. This tool is designed to transform plain text into clean, professional infographics automatically.
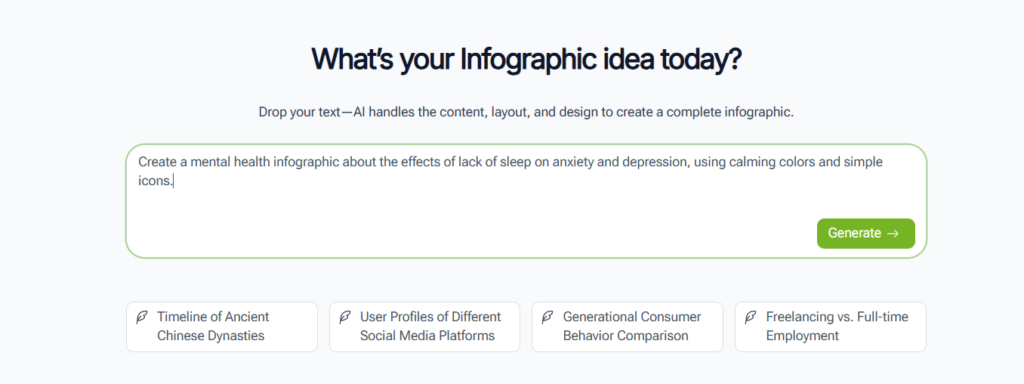
Step 3:Enter Your Prompt In the input box, write a short description of what you want. For example: “Create a mental health infographic about the effects of lack of sleep on anxiety and depression, using calming colors and simple icons.”
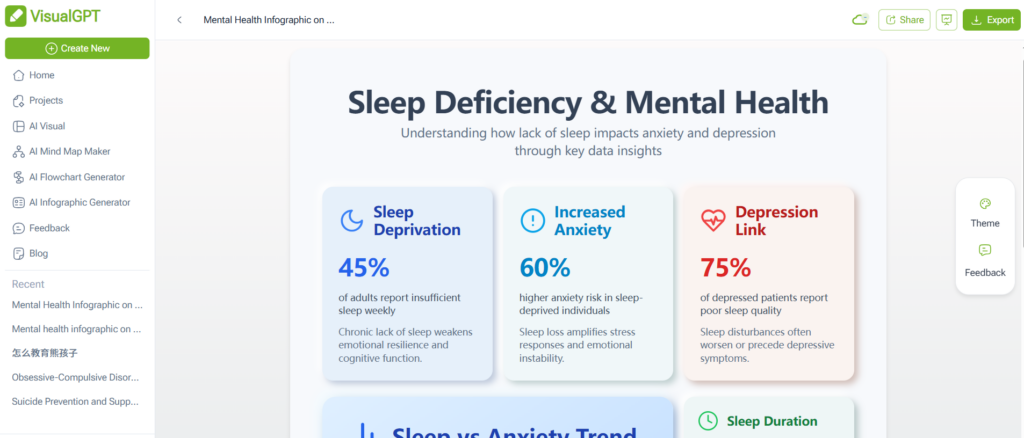
Step 4:AI -Powered Design in Seconds VisualGPT’s AI Infographic Generator instantly parses your content. It analyzes your data, chooses a layout style, and matches it with a design theme that fits your topic. The result is a ready-to-use, editable infographic.
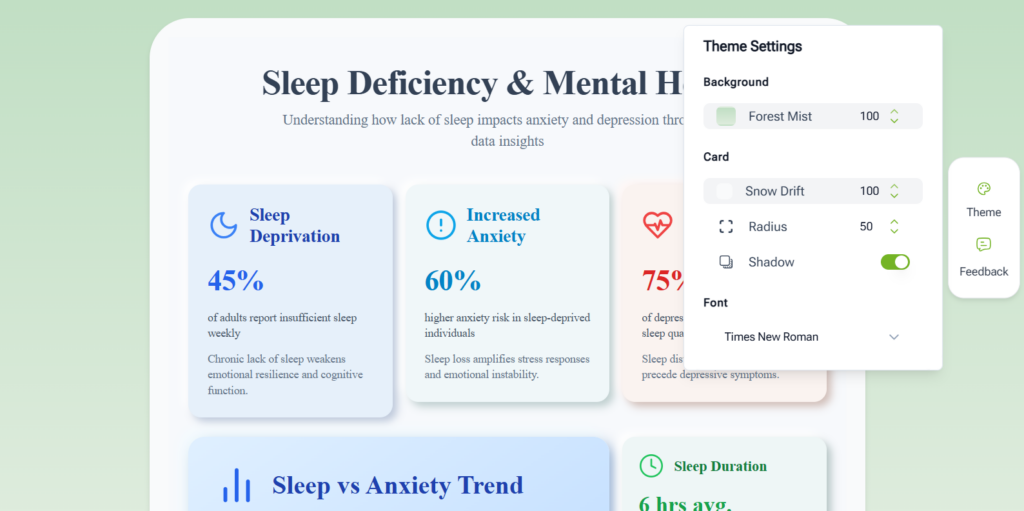
Step 5:Customize and Adjust Once the infographic is generated, you can edit the text, swap icons, change colors, or add extra notes. This ensures the design reflects your brand and communicates exactly what you want.
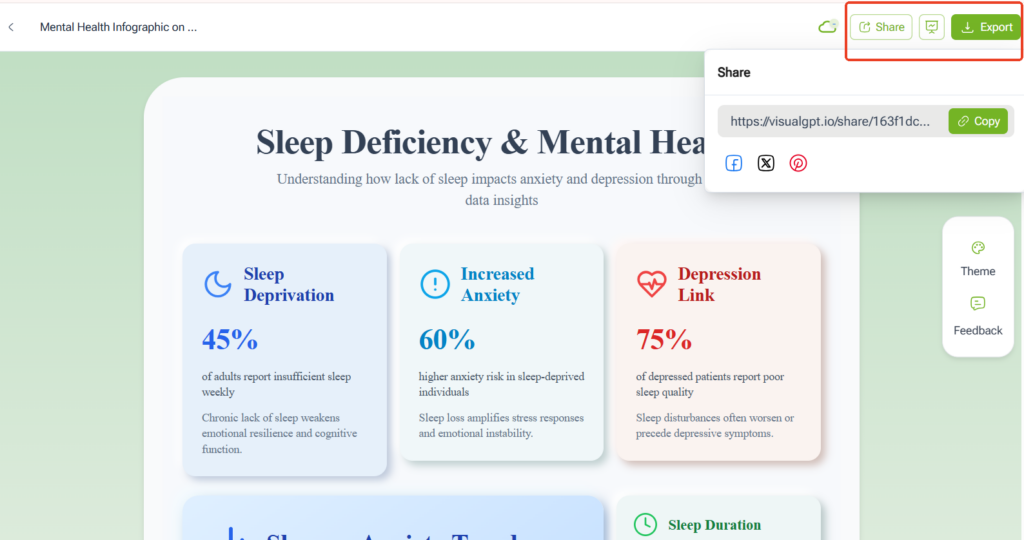
Step 6:Publish and Share Export your infographic and share it on social media, in presentations, or as part of awareness campaigns. Because the design is visually clear, it spreads fast and gets people engaged.
FAQ About Mental Health Infographics
Q1: Why are mental health infographics important? They simplify complex issues and make mental health information easier to understand and share. Instead of reading long articles, people can quickly get the main points at a glance.
Q2: Can I make mental health infographics without design skills? Yes! Tools like VisualGPT or Canva make it easy to create professional visuals without needing a design background. The AI Infographic Generator can even do most of the layout work for you.
Q3: Where can I share my mental health infographics? You can share them on social media, in classrooms, at work, or through community campaigns. They are also effective in newsletters and blog posts where visuals increase engagement.
Q4: Are infographics effective in reducing stigma? Yes. Visuals help people talk about mental health more openly and reduce shame by showing that many others face the same challenges. A single infographic can normalize difficult conversations.
Q5: What topics work best for mental health infographics? Anxiety, depression, stress, sleep, youth mental health, and suicide prevention are some of the most impactful. These topics reach a wide audience and encourage useful discussions.
Q6: How accurate should mental health infographics be? Accuracy is critical. Always base your content on reliable data from health organizations, research studies, or licensed professionals. Sharing false information can harm people instead of helping them.
Q7: Can I use mental health infographics in my workplace? Absolutely. HR teams often use infographics to share wellness tips, promote employee assistance programs, or raise awareness during Mental Health Month. They make workplace communication more approachable.
Q8: Do mental health infographics work well on social media? Yes, they are perfect for platforms like Instagram, LinkedIn, and Pinterest because people scroll quickly. A well-designed infographic can grab attention in seconds and encourage sharing.
Conclusion: The Impact of Mental Health Infographics in 2025
Key Takeaways from the Top 10 Mental Health Infographics
In 2025, mental health infographics are more than just pretty visuals. They’re educational tools that turn numbers and facts into stories people can actually understand. From anxiety trends to youth coping strategies, each infographic sparks awareness and encourages people to take action.
Encouraging Awareness and Action Through Mental Health Infographics
You don’t need to be a doctor or designer to make a difference. With tools like VisualGPT and the AI Infographic Generator, anyone can create clear, effective visuals that raise awareness. By sharing these infographics, you’re not just spreading information—you’re helping fight stigma and encouraging healthier conversations.
The future of mental health is not just about treatment. It’s about understanding, awareness, and connection. And mental health infographics are one of the most powerful ways to make that happen in 2025.