
From Reading to Seeing: Why Visual Representation Matters
The Rise of Visual Content in a Digital World
In today’s world, we see more pictures, videos, and graphics than ever before. Social media, news, marketing, and even education rely on visual content to grab attention. Why? Because visuals speak faster than words. People scroll quickly. If something doesn’t catch their eye, they move on. That’s why more creators and businesses are turning to a visual representation to make their ideas stand out.
Why Humans Process Visuals Faster Than Text
Our brains are built for visuals. You might not know it, but your brain can understand an image in just 13 milliseconds. That’s way faster than reading a sentence. When you look at a visual representation of data, for example, you instantly see patterns, trends, or issues. But if you read the same information in words, it takes more time to understand. That’s why charts, maps, and diagrams are so powerful.
The Growing Need for a Visual Representation in Communication
Clear communication is more important than ever. Whether you're explaining a product, pitching a startup, or sharing research, people want to understand things quickly. Using a visual representation helps you get your message across fast. It breaks down complex ideas and makes them easier to grasp. That’s why tools like VisualGPT are becoming more popular—they help people turn ideas into visuals without needing design skills.
What Is a Visual Representation?
Defining a Visual Representation in Simple Terms
A visual representation is just a fancy way of saying "showing something with a picture or graphic." It can be anything that helps explain an idea without using only text. That includes charts, diagrams, infographics, cards, and even memes. The goal is simple: help others understand your point faster and better.
Common Types: Diagrams, Infographics, and Visual Cards
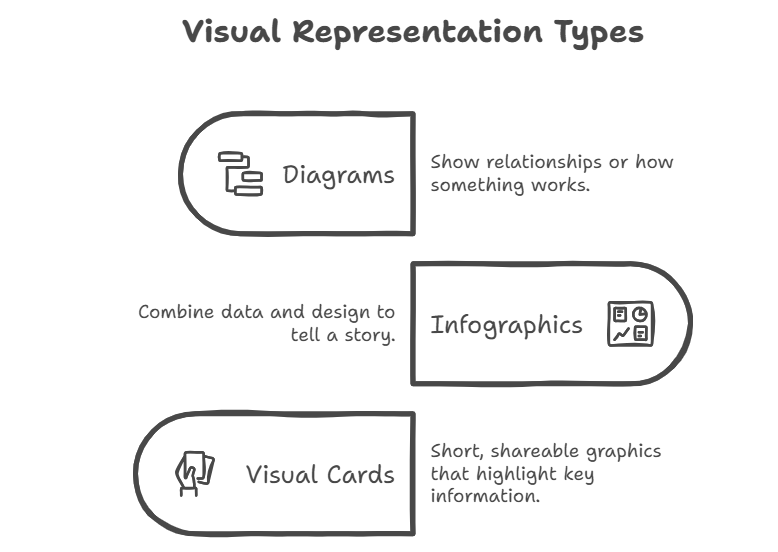
There are many forms of a visual representation. Diagrams show relationships or how something works. Infographics combine data and design to tell a story. Visual cards are short, shareable graphics that highlight key information—perfect for social media. Tools like VisualGPT let you create these visuals instantly from a simple input like a product link or a summary.
The Role of a Visual Representation in Data and Ideas
Think about a spreadsheet filled with numbers. Now imagine that same data shown in a colorful chart. Which one is easier to understand? That’s the power of a visual representation. It transforms raw data or abstract ideas into something that feels clear and meaningful. Whether you're analyzing user feedback or comparing products, visuals help you see the story behind the data.
The Limitations of Traditional a Visual Representation
Time-Consuming Design Processes
Creating graphics by hand is a labor-intensive task that demands significant effort. Designers must carefully select colors, fonts, layouts, and structures—each decision adding to the workload. For instance, crafting a single chart could take hours of fine-tuning, which is frustrating for professionals who need quick results. Traditional design tools, like Photoshop or Illustrator, weren’t built for efficiency, often forcing users to navigate complex menus and manual adjustments. Many avoid using a visual representation—even when it would enhance understanding—simply because the process is too slow. Fortunately, AI visual tools are changing this by automating repetitive tasks and speeding up creation.
Limited Flexibility and Poor Scalability
Imagine designing a chart, only to realize the data needs updating or the format must adapt for social media. With conventional tools, you often have to rebuild it from scratch—wasting time and effort. Now, consider scaling this challenge: producing 50+ visuals for a report or marketing campaign becomes a logistical nightmare. Traditional software lacks smart templates or dynamic adjustments, making large-scale projects inefficient. This inflexibility discourages teams from leveraging data visualization, even when it could improve clarity. Modern AI visual solutions, however, allow real-time edits and bulk generation, solving scalability issues.
Inconsistent Quality and Brand Alignment Issues
Maintaining brand consistency is tough when designs are created manually. Different team members might use varying color palettes, fonts, or templates—leading to a disjointed look. For example, a marketing team might produce social media graphics that feel mismatched due to inconsistent styling. This not only weakens brand identity but also creates a perception of unprofessionalism. Manual design processes amplify these risks, especially in fast-paced environments. AI visual tools can enforce brand guidelines automatically, ensuring every graphic—from infographics to presentations—stays aligned with company standards.
The Rise of AI Visual: A Smarter Way to Visualize Content
What Is an AI Visual and How It Works
An AI visual is an advanced visual representation generated by artificial intelligence, designed to transform raw data or links into engaging, professional-grade graphics. Unlike traditional design methods, AI visuals eliminate manual effort—simply input a URL, text, or dataset, and the AI instantly analyzes, extracts key insights, and structures them into a visually optimized format.
Powered by technologies like VisualGPT, this process leverages natural language processing (NLP), computer vision, and automated design principles to:
- Extract & Summarize: Identify critical information from links (e.g., articles, products, reports).
- Analyze & Highlight: Detect trends, stats, or key points through data analytics.
- Design Automatically: Apply smart layouts, color schemes, and typography for maximum visual appeal.
The result? A unique, platform-ready visual card that captures attention while maintaining clarity—all within seconds.
Key Differences Between AI Visuals and Manual Designs
AI visuals save time. They are consistent. They adapt to different platforms. Unlike manual designs, AI visuals follow set design rules automatically. They can pull content, highlight insights, and format everything nicely. With tools like VisualGPT, you don’t need to be a designer to create something that looks professional.
Key Differences Between AI Visuals and Manual Designs
Use Cases Where AI Visuals Save Time and Effort
Let’s say you run a newsletter. Every week, you share new product launches from Product Hunt. Instead of writing summaries and designing images, you paste the link into VisualGPT. Boom! You get a shareable visual card in seconds. Same if you’re building a slide deck, posting on LinkedIn, or analyzing trends. AI visuals work wherever you need quick, clear visuals.
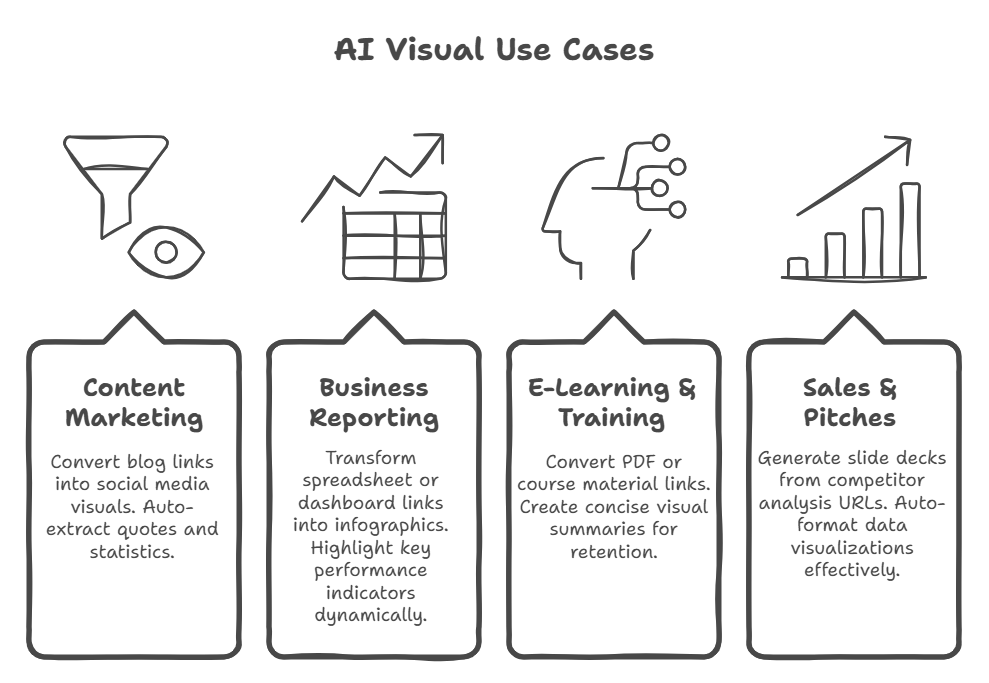
Content Marketing
- Convert blog links into social media visuals with auto-extracted quotes and statistics.
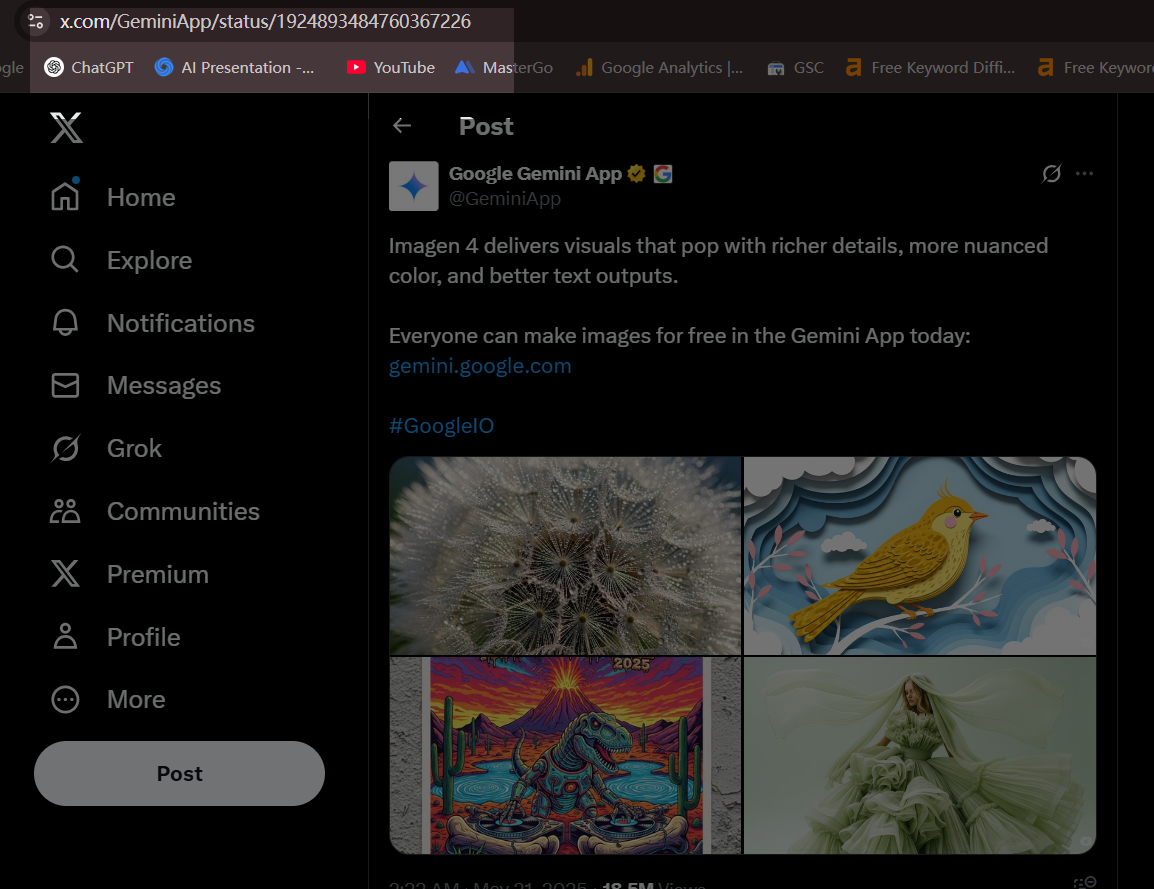
- Example: Paste a product launch page URL to instantly generate a shareable Twitter/X card.
Business Reporting
- Transform spreadsheet or dashboard links into dynamic infographics with highlighted KPIs.
E-Learning & Training
- Convert PDF or course material links into concise visual summaries for improved retention.
Sales & Pitches
- Generate slide decks by inputting competitor or market analysis URLs, with auto-formatted data visualizations.
With AI visuals, tasks that once took hours now take seconds—freeing teams to focus on strategy over design labor.
How to Quickly Create a Visual Representation Using AI
Step-by-Step Guide to Using AI Visual
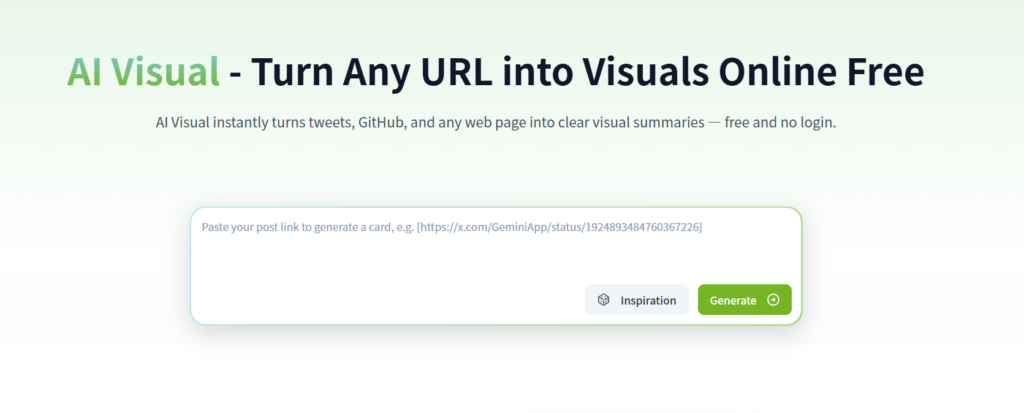
Step 1: Copy Your Target Link Simply copy the URL of the content you want to visualize—whether it’s an article, product page, dataset, or social media post.
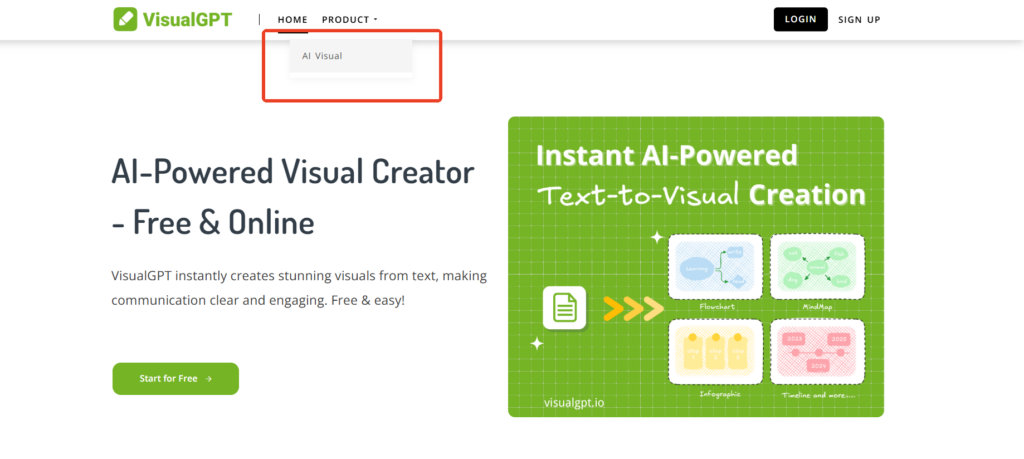
Step 2: Access AI Visual in VisualGPT Navigate to the AI Visual feature on VisualGPT, your one-stop solution for smart, automated design.
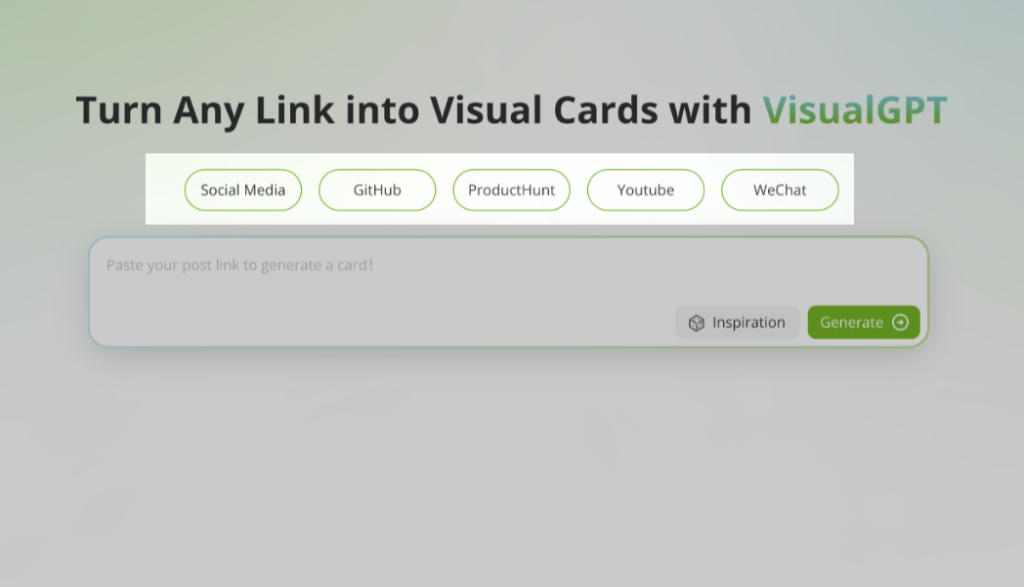
Step 3: Specify Your Needs Select the link type (e.g., news, product, report) or define the card’s purpose (e.g., social media, presentation). This helps the AI tailor the output to your exact expectations.
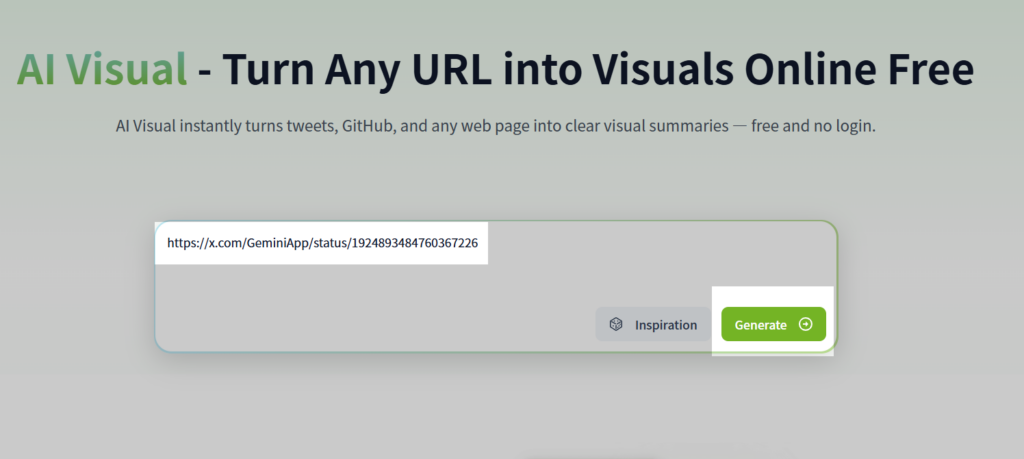
Step 4: Paste & Generate Drop the link and let AI work its magic. In seconds, it analyzes content, extracts key insights, and crafts a visually optimized card—complete with smart layouts and data highlights.
Step 5: Refine or Regenerate Not satisfied? Tweak the content or hit “Generate”again for fresh designs. The AI adapts on the fly, ensuring you get the perfect version.
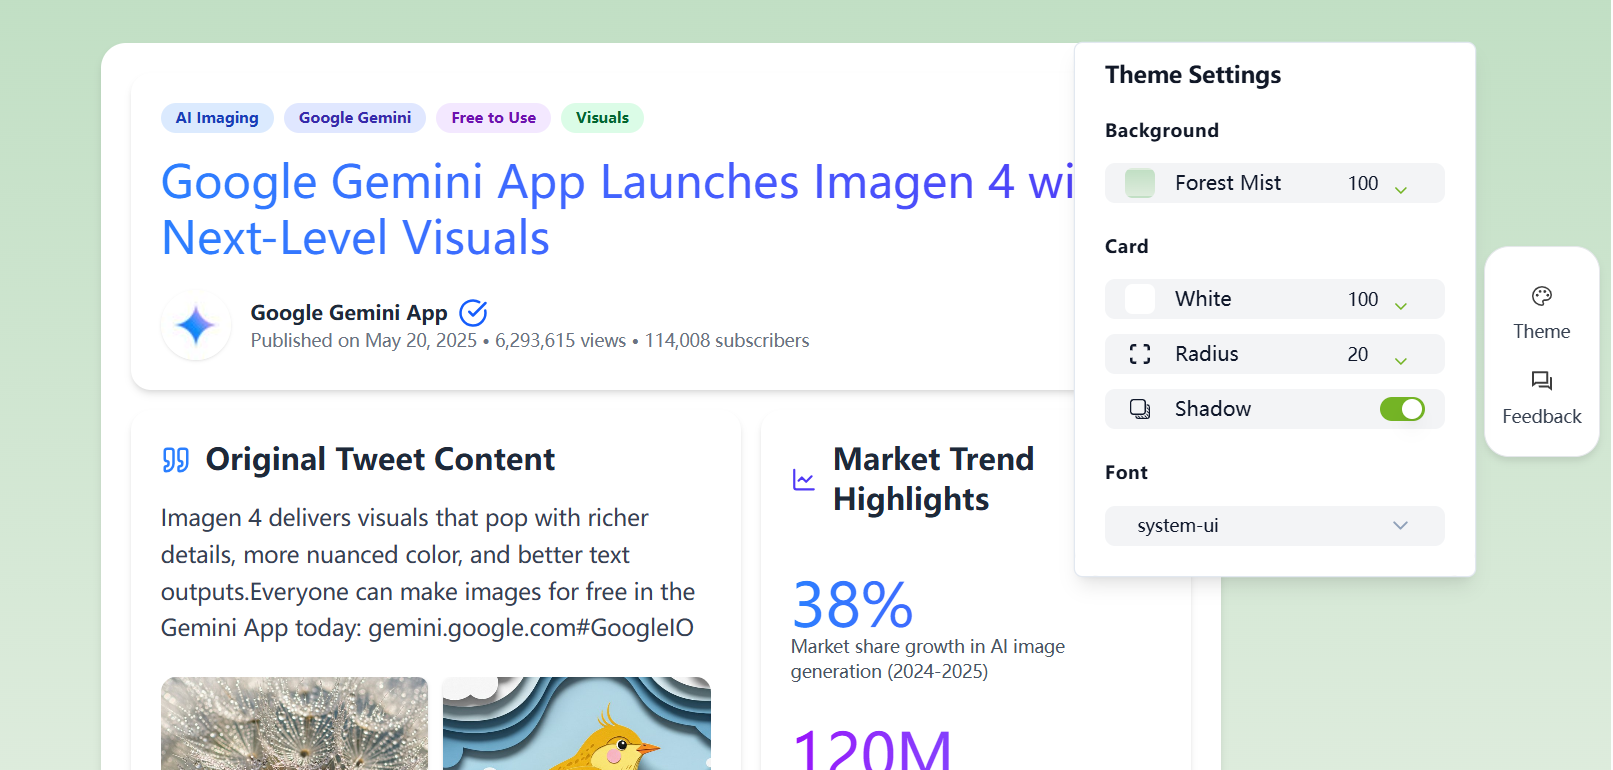
Step 6: Customize the Style Adjust colors, fonts, and layouts to match your brand or preference. Every card is fully editable, making it truly unique.
Step 7: Explore Ready-Made Visuals Skip the link-pasting! Browse real-time trending cards—curated from top news sites, rankings, and hotspots—all in one place. Stay updated without platform-hopping.
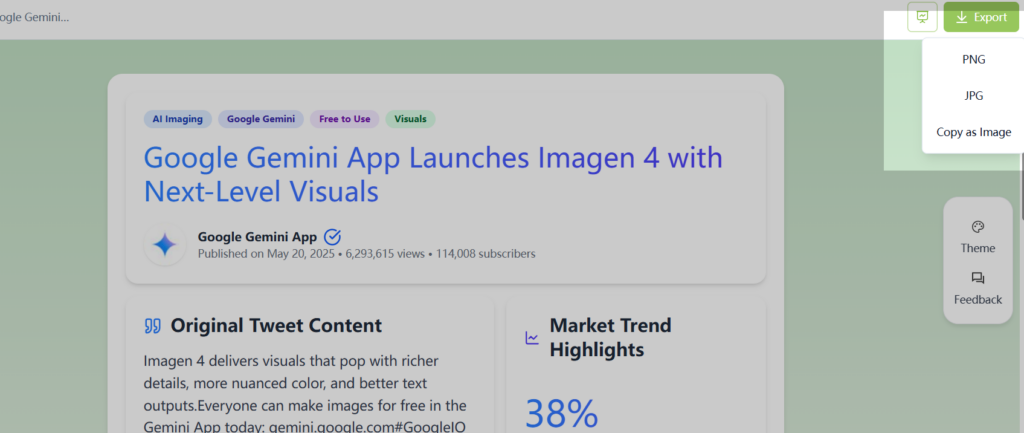
Step 8: Download or share it instantly
No design skills? No problem. AI Visual handles the heavy lifting, delivering professional, share-ready graphics in seconds.
From Links to Visual Cards in Seconds
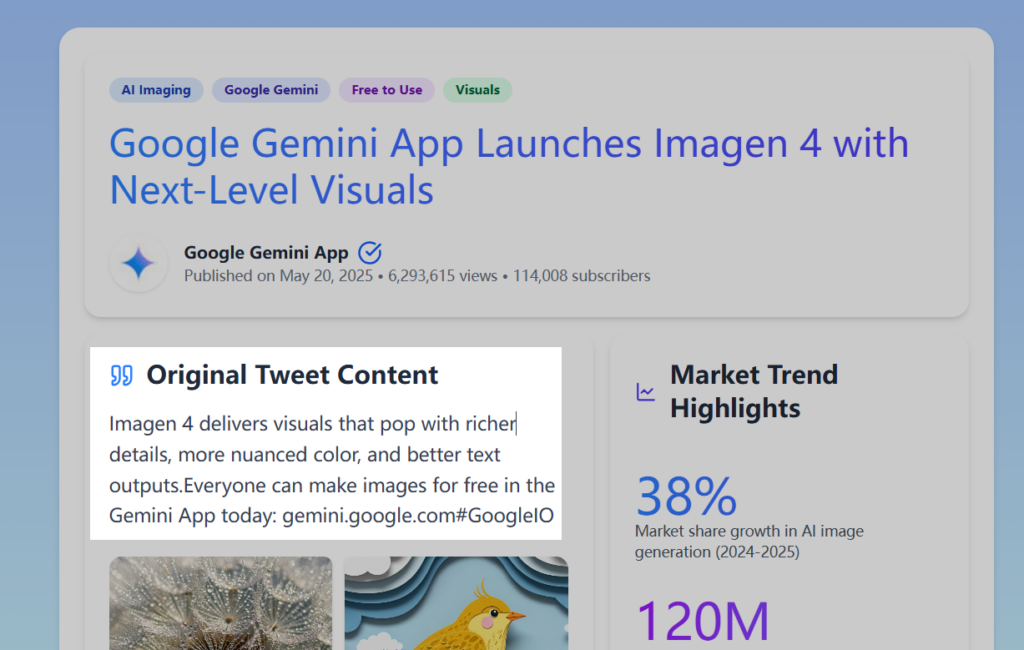
Imagine discovering an innovative product on your favorite platform. Instead of struggling to describe it, simply paste the link into VisualGPT's AI Visual tool. Within moments, the system generates a professional visual representation—complete with the product name, compelling tagline, launch details, and key features—all beautifully arranged in an eye-catching format.
This AI-powered card isn't just informative; it's designed for immediate sharing across social channels or seamless integration into your Notion workspace, Slack discussions, or presentation decks. The best part? No design skills required—just let the AI transform your links into visually appealing assets with zero effort.
Tips for Optimizing Your AI-Generated Visuals
Maximize your AI visual outputs with these targeted strategies for URL-based content:
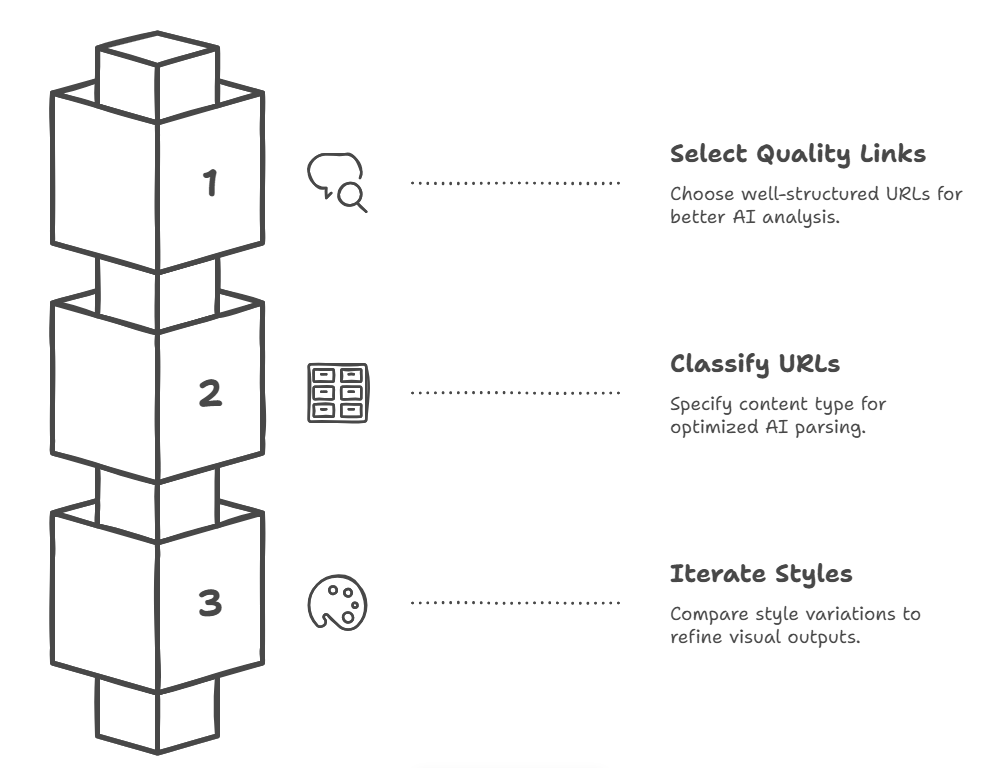
✔ Select High-Quality Source Links
- Prioritize well-structured pages (product listings, press releases, or data reports)
- Avoid overly complex or poorly formatted URLs
✔ Leverage Smart URL Classification
- Specify content type (e.g., "news", "product", "research") for optimized parsing
- The AI automatically adjusts its analysis approach accordingly
✔ Efficient Iteration Methods
- Compare 3-5 style variations per URL
With practice, you’ll get visuals that look polished and on-brand every time.
More Than Just Design: The Real Value of AI Visuals
Enhance Comprehension and Retention
Cognitive science confirms that a visual representation improves information retention by 400% compared to text alone. When you transform complex data or concepts into AI-generated visuals, you're not just simplifying content - you're creating memorable learning experiences. This neural advantage proves critical for:
- Education: Students recall visualized concepts 65% longer
- Business Pitches: Investors retain visualized data points 3x better
- Marketing: Campaigns with strong visuals see 94% higher engagement
Boost Shareability Across Platforms
In today's fragmented digital landscape, AI visual cards serve as your universal content currency. Their optimized formatting ensures flawless display across:
- Social Media (Twitter/X cards, LinkedIn snippets)
- Professional Platforms (Notion workspaces, Slack discussions)
- Email Campaigns (Newsletter feature graphics)
- Presentations (PowerPoint/Google Slides integration)
The secret? Platform-intelligent design that automatically adjusts aspect ratios, text sizing, and visual hierarchy for each destination while maintaining your core message impact.
Save Time While Maintaining Visual Quality
Modern AI visual tools eliminate the design paradox - where quality traditionally required time investment. Now:
- Layout Algorithms handle typography kerning, color contrast, and responsive spacing
- Content-Aware Systems automatically emphasize key data points and relationships
- Batch Processing enables simultaneous multi-card generation from link collections
The result? Enterprise-grade visuals produced in seconds, not hours - letting you allocate saved time to strategy and messaging refinement rather than pixel-perfect adjustments.
Who Can Benefit from AI Visual Representation Tools?
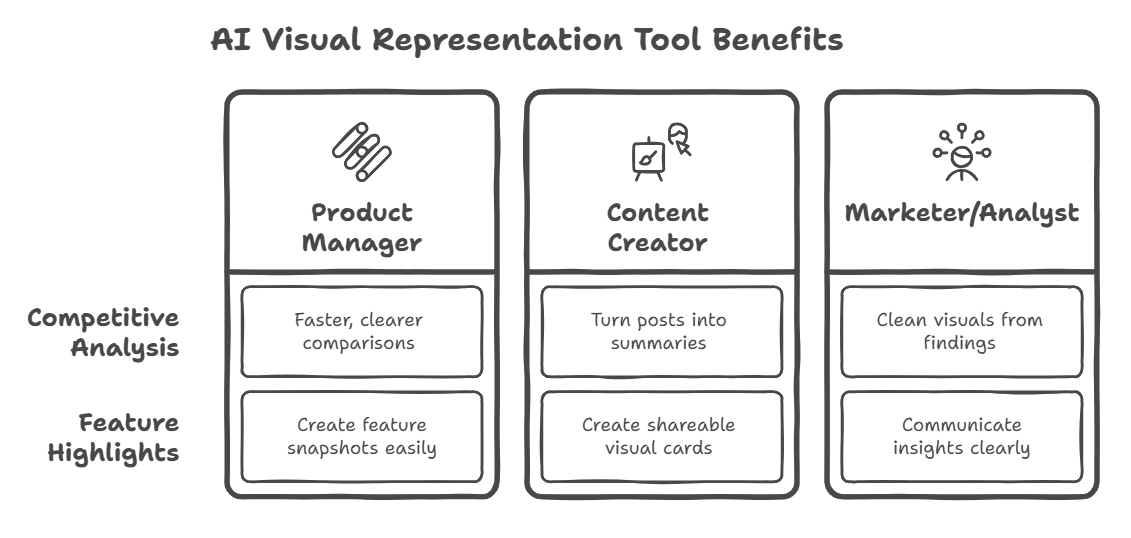
Product Managers: Competitive Analysis and Feature Highlights
Product managers often compare features, track updates, or present roadmaps. A visual representation makes this faster and clearer. With AI visuals, PMs can create comparison cards or feature snapshots without design help.
Content Creators: Turning Information into Shareable Cards
If you write blogs, post on social, or run a newsletter, you need eye-catching content. AI visuals help you turn long posts into quick summaries. Visual cards are also great for repurposing content across platforms.
Marketers and Analysts: Communicating Insights Clearly
Charts and reports are hard to digest. AI visuals turn complex findings into clean visuals. That’s gold for marketing teams and analysts. You get more eyes on your insights and better responses from your audience.
The Future of a Visual Representation in the Age of AI
Evolving from Static Graphics to Intelligent Visuals
Old graphics are passive. AI visuals are active. They can update in real-time, adapt to the platform, and reflect your brand. The future of a visual representation is smart, fast, and flexible.
How AI Visuals Will Integrate into Daily Workflows
Soon, AI visuals will be part of everything you do. Imagine writing a blog and getting visuals auto-generated. Or running a product launch and having visuals ready in minutes. That’s where tools like VisualGPT are headed.
Visual Thinking as the Future of Communication
We’re moving from reading to seeing. A visual representation will be the default way we explain things. With AI helping us, anyone can turn ideas into visuals. You don’t need design skills—just a message to share.
Visuals matter more than ever. And with AI visual tools like VisualGPT, turning ideas into clear, beautiful visuals is easier than ever. Whether you’re a student, marketer, founder, or teacher, using a visual representation can help you share smarter, faster, and better.